
Artificial neural network modeling using clinical and knowledge independent variables predicts salt intake reduction behavior
Introduction
Hypertension is considered as the highest attributable risk for mortality in the world, accounting for 16.5% of global deaths annually (1). It is estimated that high dietary salt intake is accountable for up to 30% of the prevalence of hypertension (2). Furthermore, Mozaffarian et al. showed that excessive dietary sodium intake was responsible for 1.38 million cardiovascular disease (CVD) deaths worldwide in 2010; 45% were due to coronary heart disease (CHD), 46% due to stroke, and 9% due to other cardiovascular complications. From the preventive point of view, He et al. showed in a meta-analysis that reducing salt intake to 6 g/person/day would reduce the incidence of stroke and ischemic heart disease (IHD) by 24% and 18%, respectively. Achieving this reduction through increasing awareness and knowledge of patients is thought to help reduce the overall burden of CVD.
Knowledge is believed to have a strong influence on attitude which in turn defines one’s behavior (3). Numerous studies have used regression analyses to show that nutrition knowledge is a predictor of eating behavior for various food groups (4,5). In particular, studies have shown that consumers claim to eat less salt than their true intake due to lack of knowledge on main contributors to salt in the diet (6,7). However, the exact nature of the association between nutrition knowledge or attitudes and dietary behavior remains a considerably controversial topic (8).
Predicting the patients’ adherence to a low salt diet from determining his baseline knowledge would be vital for guiding educational interventions and in bridging the knowledge gap. Nutrition behavior prediction algorithms proposed thus far have been predominantly based on least squares models (LSMs) methods of modeling applied to observed prediction accuracy. Known limitations of LSM might affect its applicability and accuracy in prediction models. In particular, as the complexity of the relationship between the dependent and independent variable increases and is non-linear, the LSM method becomes less capable in predicting the outcome correctly (9). The latter complexity, we hypothesize, could be a reason behind the controversial association between nutritional knowledge and behavior (9). One particular outcome prediction model gaining popularity in the clinical research field is artificial neural network (ANN) which aims to “uncover the hidden causal relationships between single or multiple responses and a large set of properties” (10). This computational model functions similarly to our central nervous system in the sense that a node, or neuron, incorporates signals and processes them. The complex integration of inputs follows the multilayered matrix decision model which in turn leads to the final outcome (11). ANN is widely used in behavior prediction with high accuracy, such as in predicting customers’ behavior (12,13), intentional violations by employees (14), and pattern of physical activity level in children (15). Earlier attempts to use neural networks for prediction of nutrition behavior have hypothesized improved accuracy by neural network based algorithms and potential impact on the prevention of CVDs (16). In theory, ANN modelling approaches to nutrition behavior prediction may minimize or avoid some of the limitations of the LSM and may result in more accurate behavior prediction to direct a more influential educational intervention. Yet, to date, ANN modeling has not been applied in predicting salt use behavior. Accordingly, we aimed to compare LSM and ANN modeling using key knowledge independent variables (KIVs) to predict salt reduction behavioral class in a high cardiovascular risk cohort and to develop an online tool using this model that can facilitate its implementation in future research.
Methods
Study design
Data collection, inclusion, and exclusion criteria
We included adult patients, from both genders, with a history of acute presentation of Hypertension, coronary artery disease (CAD), congestive heart failure, and/or history of Stroke/Transient Ischemic Attack admitted to the Cardiac Care Unit. Sample size calculated was based on recent data that around 82.2% of adults in the Lebanese community are estimated to be aware that salt/sodium worsens health (17). Taking this percentage into consideration with a confidence interval of 7%, and considering a type 1 error of 5%, a representative sample of 115 patients out of 1,500 annual CCU admissions is needed. Patients who agreed to participate were surveyed using a questionnaire on knowledge, attitude, and behavior (KAB) pertaining to salt intake. The study was approved by the local Institutional Review board.
Study instruments
The development of the questionnaire (Supplementary 1) was based on a thorough review of the literature and the questions were modelled on those used in past surveys (18-20) but culture-specific modifications were introduced, such as the examples of foods that were included (Supplementary 1). The questionnaire was translated to Arabic. The Arabic version of the questionnaire was reviewed by two Arab speaking research nutritionists to ensure that the wording of the questions was culture-specific (17). The questionnaire was previously field-tested and adopted in a recent study conducted on adult Lebanese consumers recruited from shopping centers in Beirut (17). Patient answers were translated into numerical values to be used in the statistical methods. The questionnaire has three parts: knowledge, attitude and behavior questions. The knowledge questions are 31 objective questions that have one correct answer. Hence, numerically, every question was represented by either 0 (wrong answer/don’t know) or 1 (correct answer). These questions addressed familiarity with daily salt intake requirements, as well as knowledge about different foods and their salt content. It also tackled knowledge on salt and its associated health hazards. The internal consistency of the knowledge questionnaire was previously shown to be relatively high, with the Cronbach’s α reliability estimate being of 0.748 (17).
The attitude questions are 14 qualitative questions that have four choices. The choices were designed to reflect the patient’s attitude towards reducing salt intake, from not favorable attitude to favorable attitude. Numerically, every question is represented by an integer number, ranging from 1 (not favorable) to 4 (favorable). These questions inquired on the patient’s concern with salt levels in food, ability to comprehend nutritional information, appropriateness of information on food labels, incentives for reducing salt intake, and barriers against salt reduction. The internal consistency of the attitude questionnaire was previously shown to be relatively high, with the Cronbach’s α reliability estimate being of 0.724 (17).
Similarly, the behavior questions are 11 qualitative questions that have four choices. The choices are designed to reflect the quality of behavior from not favorable to favorable behavior. Numerically every question is represented by an integer number between 1 (not favorable) and 4 (favorable). These questions tackled whether patients actively reduce their intake and how, whether they look at food labels and what they look for.
Twenty-four CIVs were added as real values extracted from medical tests performed on the subject. They included patient characteristics and laboratory values such as Blood pressure, BMI, family history, past medical history, blood cholesterol levels, and current medication. These values were then introduced into the statistical learning algorithms that were used in order to perform prediction.
Calculation of salt behavior score (SBS)
Using the 11 behavior questions, where every question represents one IV, we were able to compute a SBS for every subject. SBS was computed by adding up all integers representing the 11 questions. Hence, the lowest SBS that a subject can have is 11. It represents very unfavorable behavior. On the other hand, the highest SBS that anyone can achieve is 44. It represents a very favorable behavior. SBS was computed for all subjects. The mean score of the study sample was 29±5. Hence the behavior score categorized patients into one of three classes: a non-favorable class, labeled C, represented by a score less than 26; a less favorable class, labeled B, represented by a score between 26 and 31; and a favorable class, labeled A, represented by a score larger than 31. The three classes defined by this index are based on thirtiles of the behavior score for all subjects. The lowest cutoff point of 26 represents the 33% thirtile of the behavior score for all subjects, while the 2nd cutoff point of 31 represents the 66% thirtile of the behavior score of all subjects. The choice of thirtiles is justified by the appended questionnaire. All the behavior-related questions have three different answers; one indicates if the behavior of the person is very favorable, another indicates a less favorable behavior and finally an answer that indicates unfavorable behavior.
Data analysis
The LSM is the starting point for devising any best-fitting model. It is essential to implement LSM because it gives an indicator about the relevance (P value) of each of the predictors. A linear LSM is given in general by y = β’.x Eq. [1], where x is a column vector of all predictors, β a column vector of the coefficients associated with every predictor and y represents the predicted risk. The LSM algorithm finds the best vector β that fits this model.
After the data collection phase, we place the predictors for every subject in a matrix X, where every row corresponds to one subject, and the corresponding risks of all subjects are placed in a column vector y. Then the coefficient vector is computed using: β = (XTX)−1XTy. This method yields the best linear model that fits the data. Referring to it as best indicates that this is the model that minimizes the square error. Non-linear models can also be considered. However, in regression methods, there is no systematic way to know the non-linear function that relates the input vector x to the output y. One can try Log function or exponential function, but the best model might be more complicated than just a log or an exponential. The solution to this problem comes with ANN as described in the next section.
A detailed introduction to ANN has been described by Hagan et al. (21). In this study, a standard feed-forward multilayer network was used. It consisted of ten input layers and one output layer. The input layer consists of ten neurons, to which is connected all the observed IVs. The output layer consists of 1 neuron since the output of the network has to be a single real number representing the predicted class. In total, we have 11 neurons: a hidden layer containing ten neurons and an output layer containing another neuron. The network architecture was chosen using a standard systematic method where the number of hidden neurons is changed incrementally, and the network that gives the highest overall accuracy (derivation/validation) is chosen. The transfer function in the hidden and output layers is the tangent sigmoid function defined by 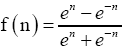 Eq. [2].
The training of the network was done using the Levenberg-Marquardt back-propagation algorithm. This algorithm finds the weights that minimize the error using a variation of Newton’s method for minimizing functions (22). This algorithm was chosen because it is the fastest neural networks training algorithm for moderate size networks (21) as is the case in this study. The validation cohort was based on 25 patients from the total sample whereas 90 patients were used as a derivation cohort. During the training phase, the derivation cohort was randomly split into 80% training and 20% validation. The training was repeated 200 times and the model that yielded the lowest error was used on the validation set.
Reduced model (RM)
The nature and structure of the questionnaire suggests that a possible correlation exists between different predictors. Hence, a correlation study was performed over every part of the questionnaire independently including all the questions as predictors. The outcome of the ANN model is the behavior class.
For the KIVs, a cross correlation matrix was computed. This matrix shows the correlation between all possible combinations of predictors. Then the correlation coefficient R is examined. If two predictors are correlated with R >0.5, then one of the two predictors is dropped. This procedure was carried out over the attitude independent variables (AIVs) as well as the CIVs. This is a standard method used for feature reduction, it keeps the features that have high variance and if two features have both high variance but correlated together then one of them will be eliminated (23).
This procedure yielded a great reduction in the number of predictors used. This model is referred to later on in the paper as reduced model. We will also present in the results section, a comparison between the RM and the full model (FM).
LSM versus ANN performance comparisons
To compare the performances of the LSM and ANN in predicting the behavior class, the following method was used. The data was split randomly as 80% derivation cohort (92 subjects in total) and 20% validation cohort (23 subjects in total). Next a 200-iteration bootstrap was performed. In every iteration, 92 subjects were picked randomly with repetition from the derivation cohort (one subject might appear more than once). These 92 subjects were used to derive the optimal model. This model was then used to get the accuracy on the validation cohort (percentage of subjects that were correctly classified). It is important to note that the validation cohort was never used during the derivation phase. Finally, the average prediction accuracy over the 200 iterations, which represents the number of subjects that were correctly classified by our model, is used to evaluate the performance of the LSM model and the ANN model.
Results
Our cohort consisted of 115 high-risk patients (mean age in years: 60.63±15.39) including 74 (64.3%) men (Table 1). The mean BMI was 31.30±22.39 kg/m2. Of the study sample, 74.6% were hypertensive, 43% were diabetic, 32.5% had a history of angina, 32.7% had a history of congestive heart failure, and 34.2% had a history of myocardial infarction. A history of coronary artery bypass graft (CABG) and percutaneous coronary intervention (PCI) were noted in 28.1% and 38.6% of the sample, respectively, while 30.7% underwent PCI during the current visit. A family history of CAD, hypertension, and diabetes was reported in 26.3%, 24.6%, and 25.4% of the sample, respectively. Two thirds of the participants were non-smokers (62.3%).

Full table
From the bootstrap analysis with 200 iterations we showed that using the FM variables to predict behavioral class, the highest accuracy achieved by LSM in the validation cohort was 40% CI (56-60%) (Table 2). This was attained from including knowledge and attitude questions only.

Full table
The LSM model obtained is given by the following formula:
Class =1.34+0.15.q9−0.14.q10b+0.38.q10c+0.07.q10d−0.03.q11−0.01.q13+0.24.q14a+0.06.q14n−0.11.q21+0.03.q22a−0.14.q25-0.6.q26+0.8.q27−0.01.q30+0.07.q32.
Where q9, q10, q11, q13 and q14 are equal 1 if the patient answers the corresponding question correctly and 0 otherwise, and q21, q22, q25, q26, q27, q30, q32 are the attitude scaled numbers calculated from the patient’s answers to the corresponding questions (1 being not favorable to 4 being favorable).
Furthermore, the cross correlation study has shown that RM can be described using only 8 knowledge, 7 attitude, and 5 clinical questions instead of a total of 31, 14, and 24 questions, respectively. The eight remaining knowledge questions inquire about the effect of the salt/sodium on health, whether there is a causal relationship between salt and stroke, osteoporosis, and fluid retention, the recommended maximum daily intake of salt, the relationship between salt and sodium and knowledge of salt/sodium level in Bread. The seven remaining attitude questions cover the comprehensibility of nutrition information on sodium present on food labels, whether patients were concerned about artificial flavors in food products, the importance of reducing the amount of salt and sodium added to food and the amount of processed foods consumed. It also inquired on the worst possible scenario that could result from excessive salt intake, and who the responsible party is in terms of reducing salt intake per individual. The five remaining CIVs measure systolic and diastolic blood pressure, pulse, smoking status, and medical history of hypertension. In the RM bootstrap analysis, the LSM needed knowledge, attitude and clinical variables to attain the highest accuracy of 34% CI (17-47%) in correctly predicting behavioral class (Table 3).

Full table
Alternatively, Table 2 shows that ANN outperforms LSM in any possible IV combination on the validation cohort and in some cases, ANN has double the accuracy of LSM. The highest validation accuracy was recorded at 66% for the knowledge + attitude + clinical in ANN FM, compared to 40% CI (56-60%) accuracy of the best LSM FM, using a set of 46 knowledge and attitude questions. The validation accuracy over that of derivation is noted to be comparable between the two algorithms. However, the average relative increase in accuracy between ANN and LSM over all possible IV combinations on the validation data is 82%.
Similarly, in Table 3 we demonstrate the power of ANN compared to LSM as it outperforms it in all possible IV combination using the reduced model variables. On average, the relative increase in accuracy of ANN over LSM in all reduced models combined is 102%. The most accurate LSM RM is the one using the combination of knowledge, attitude and clinical set of 20 questions at 34% CI (17-47%), whereas the best ANN RM is the one using 8 knowledge questions only at 62% CI (58-67%). The ANN model obtained is given by the formula in Supplementary 2.
To illustrate further, Figure 1 compares the best FM using each method while Figure 2 compares the best RM using each method. Figure 1 shows that using ANN, the behavior class of 66% of the patients was correctly predicted whereas 34% were misclassified by one behavioral class. No patients were grossly misclassified, that is, misclassified by 2 behavioral classes. On the other hand, using LSM, the behavior class of only 38% of the patients was correctly predicted whereas 40% were misclassified by one behavioral class, and 22% were grossly misclassified.


Similarly, Figure 2 shows that using ANN, the behavior class of 62% of the patients was correctly predicted whereas 38% were misclassified by one behavioral class. No patients were grossly misclassified, that is, misclassified by two behavioral classes. Using LSM, the behavior class of only 34% of the patients was correctly predicted whereas 34% were misclassified by one behavioral class, and 32% were grossly misclassified.
Discussion
The ANN-based algorithm provided superior accuracy for predicting patient behavior towards salt intake reduction over the LSM-based model, with an average relative increase in accuracy of 82% between the best ANN RM over the best LSM RM, while in FM, the relative increase in accuracy was 65%. In FM, the ANN-based model requiring all IVs achieved the highest validation accuracy at 66% CI (62-69%). In ANN RM, only eight KIVs were required to achieve the highest validation accuracy at 62% CI (58-67%). While only 34% were misclassified using ANN FM, 40% were misclassified and 22% were grossly misclassified using LSM FM.
To our knowledge, no previous study has tried to predict salt intake behavior using an ANN-based model. However, a study by Borowiec et al. utilized neural networks to predict food type purchase patterns based on a set of independent variables including socio-demographics and the economic capability of buying thirteen different food product categories. Households were split into two clusters or nutrition status groups. The first can buy only basic food categories while the other group can buy all food categories. The obtained classification error rate for the best neural network was lower than the corresponding error rate for both Discriminant analysis and Logistic regression, and hence ANN improved the classification accuracy and outperformed statistical methods (16). Moreover, although both LSM and ANN can be used as non-linear regression or classification methods, the main drawback of LSM is the need to try out several non-linear models such as logarithmic and exponential, among others. Hence, only trial and error can tell which model fits best. However, the structure of ANN combined with its optimization algorithms will learn from the data the best model to use and its parameters (21).
Furthermore, though our ANN model improved the rate of correctly classified individuals, nearly 1/3 remained misclassified (none were grossly misclassified) (Figure 2). To contextualize this finding we compare this performance to other classification tools commonly used in cardiology. For example, the Heart Score model and coronary calcium score, both used to assess cardiovascular risk, have significant rate of discordance. Among those deemed as high risk by the Heart Score system in low-risk countries, only 17% would be classified as high risk by coronary calcium scoring (28). Similarly, the thrombolysis in myocardial infarction (TIMI) score, a commonly used scoring tool to risk stratify patients presenting with acute coronary syndrome, was found to have a short term AUC of 0.66 (95% CI, 0.64-0.68) and 0.73 (95% CI, 0.69-0.78) in derivation and validation cohorts respectively (29). This indicates that nearly 27-34% of individuals were misclassified. The above indicates that our ANN model’s performance is within the same range of other very commonly used models in the field of cardiology. However, because of only 66% level of accuracy, future studies to further improve this tool are warranted for it to become applicable in the clinical setting.
The behaviour classification model we followed was inspired by prior nutrition studies (4,30). Sharma et al. used multiple logistic regression analysis to show that nutrition knowledge was a strong predictor of eating behavior for all food groups except fruits and vegetables. This was done by creating a nutrition knowledge score and an eating behavior score of recommended servings per day of food types as dichotomous variables; i.e., correct and incorrect knowledge and behavior (4). A systematic review examined the relationship between nutrition knowledge and dietary intake in adults, and showed that a higher intake of fruit and vegetables was associated with higher nutrition knowledge (30). Adopting this approach, we believed, would provide meaning to the number provided for the score directly. This is instead of having to take the score achieved and then refer back to the cut-points to see where an individual’s score is relative to the distribution of scores. Ideally, this should be verified by a prospective study against 24-hour urine sodium, which will be further discussed in a subsequent section.
ANN FM had prediction accuracy higher by 4% than ANN RM. In terms of clinical applicability, a loss of 4% accuracy in determining patient behavioral class when using eight questions in ANN RM instead of 69 questions in ANN FM may be considered a worth loss in favor of wider applicability secondary to decreasing the number of questions. The average relative increase in accuracy between ANN and LSM over all possible IV combinations on the validation data is 80%. This shows the power of ANN for prediction over the standard LSM.
Implications for research and practice
Working with high-risk individuals to reduce their salt intake through raising their awareness about the health hazard of salt and how to cut it down is currently being practiced. However, having a tool that can predict a patient’s behavior after an awareness raising activity can potentially identify the efficacy of this activity, and accordingly help modify it to improve it. At cardiac care units in general, including ours, dietary consultants—or other healthcare workers—meet with the patients and advise them about salt reduction. This is also provided for outpatients as part of preventive measures. Using efficacy assessing tools such as the one in hand, we can identify whether such efforts are possibly leading to an outcome (adopting salt intake reducing behaviors in this situation) or not. This will ensure proper allocation of resources, dietary consultants’ time and effort, and avoid burdening our patients with inefficient interventions. At a larger scale, this tool can potentially be used to gauge consumer responsiveness to public media campaigns with the advent of being concise and rapid.
It is well known that the best outcome measure of a salt reduction intervention would be to perform a 24-hr urine collection of sodium. However, this is well known to be cumbersome for the patients. Therefore, having this tool as a surrogate of a behavioral change may be a reasonable approach, although certainly not ideal. To our knowledge neither the original survey, nor our culturally adopted version, have been cross validated against 24-hr urinary sodium. This is a short-coming that needs to be addressed in a future study. However, the results of this survey have been accepted as a measure of behavior in literature before (18-20), and our ANN analysis is a secondary analytical modification based on this.
Salt awareness level tool (SALT)
To facilitate the utilization of the ANN model, the SALT was developed in order to create an accessible interface to calculate the behavior class of a patient from a few questions as illustrated below in a screenshot of SALT (Figure S1). SALT gives the ability for the user to input eight KIVs and five CIVs and use them for prediction with 60% accuracy. The software was developed using C# and is also be available as an online calculator at http://www.aub.edu.lb/fm/vmp/research/Documents/ann-salt.htm.

Conclusions
ANN based model using knowledge and clinical variables predict salt intake reduction behavior with superiority over all possible LSM models. A minor loss in accuracy when using ANN reduced model over ANN FM is insignificant when compared to the practicality offered by the RM-based tool based. Because of only 66% level of accuracy, future studies to further improve this accuracy level are warranted for it to become applicable in the clinical setting. Furthermore, validation and improvement of the accuracy of the tool using larger cohorts of different health and ethnic backgrounds and against 24-hr urinary sodium is required to achieve its full potential and benefit in clinical and public health interventions.
Limitations
Despite proving the superiority of ANN over LSM in all models, 34% of the patients were misclassified using the best ANN model, which can be attributed to the small sample size used to conduct this study. Moreover, our cohort consisted of high-risk patients in the CCU, which might question the applicability of the tool on everyday patients who visit their physician’s clinic or even on the general population. Accordingly, improving the accuracy of the model will require implementing the derivation and validation on larger cohorts, and from different ethnic and health backgrounds to validate the tool across different nations and societies. Importantly, the original survey used and the new tool need to be cross-validated against 24-hr urine sodium to ensure behavioral class is correlated with Na intake. The issue of validating against 24-hr urine sodium is crucial for this model to become utilized in clinics in general and in particular HTN specialized clinics.
Acknowledgements
We would like to acknowledge Mrs. Laila Al-Shaar for conducting the sample size calculation and descriptive statistical analysis of the data.
Funding: Faculty of Medicine, American University of Beirut, Beirut, Lebanon.
Disclosure: The authors declare no conflict of interest.
Supplementary 1
Knowledge, attitude, and behavior (KAB) questionnaire used in data collection
Knowledge, attitudes and behaviors related to sodium intake of Lebanese adults
Recruitment place:
Subject:
□ Patient
1. Sex
□ Male
□ Female
2. What is your age? (Years)
□ ‘19-30’
□ ‘31-40’
□ ‘41-50’
□ ‘51-60’
□ ‘61 plus’
3. Where do you live? (Governorates) (Please tick one box only)
□ Beirut
□ Mount Lebanon
□ North
□ South
□ Bekaa
□ Nabatieh
4. Have you ever or are you specialized in a health-related major (Biomedical, Nutrition, Food science, Medicine, Public Health, and Nursing)? (Please tick one box only)
□ Yes, specify: _____________
□ No
5. Which of the following best describes your highest level of education? (Please tick one box only)
□ Intermediate or lower
□ High school
□ Technical degree
□ University bachelor’s degree (BS) or higher (Master or PhD)
6. What type of school did you attend? (Please tick one box only)
□ Private school
□ Public school
7. How many rooms are there in your house (excluding bathrooms, kitchen, balcony and garage)? ________________
8. How many people live in your house (excluding newborn infant)? ______________
9. Which of these best describes what you think is the effect of the salt/sodium in your diet? (Please tick one box only)
□ Improves your health
□ Has no effect on health
□ Worsens your health
□ Don’t know
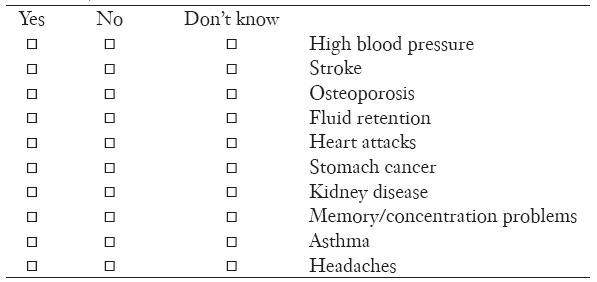
10. Do you think these health problems can be caused or aggravated by salty foods? (For each problem please select yes, no or don’t know)
11. What is the maximum daily amount of salt recommended for adults? (Please tick one only)
□ 3 grams (½ teaspoonful)
□ 6 grams (1 teaspoonful)
□ 9 grams (1 ½ teaspoons)
□ 12 grams (2 teaspoons)
□ 15 grams (2 ½ teaspoons)
□ Don’t know
12. How do you think your daily salt intake compares to the optimal amount recommended? (Please tick one only)
□ More than the maximum recommended
□ About the maximum recommended
□ Less than the maximum recommended
□ Don’t know
13. Which of the following statements best describes the relationship between salt and sodium? (Please tick one only)
□ They are exactly the same
□ Salt contains sodium
□ Sodium contains salt
□ Don’t know
14. Below is a list of everyday foods. For each please indicate whether you consider these foods to be: high, medium or low in terms of salt/sodium content. (Please tick one box for each food)
15. Which of the following do you think is the main source of salt in the diet of Lebanese people? (Please tick one only)
□ Salt added during cooking
□ Salt added at table
□ Salt in processed foods such as breads, cured meats, canned foods and takeaway
□ Salt from natural sources such as vegetables and fruits
□ Don’t Know
16. How often do you check food content labels when you are shopping? (Please tick one only)
□ Often
□ Sometimes
□ Never
□ I never do grocery shopping therefore this question is irrelevant
17. Does what is on the food content label affect whether or not you purchase a food item? (Please tick one only)
□ Often
□ Sometimes
□ Never
□ I don’t do grocery shopping therefore this question is irrelevant
18. How often do you look at the salt/sodium content on food labels when you are shopping? (Please tick one only)
□ Often
□ Sometimes
□ Never
□ I never do grocery shopping therefore this question is irrelevant
19. How often does the salt/sodium content shown on the food label affect whether you purchase a product? (Please tick one only)
□ Often
□ Sometimes
□ Never
□ I never do grocery shopping therefore this question is irrelevant
20. What information on the food package do you use to determine how much salt is in the product?
□ The sodium level in the nutrition information panel
□ The ingredients list
□ Claims for low or reduced salt on the pack
□ Other (specify) _____________
□ Don’t know
21. Do you think present nutrition information on sodium is comprehensible? (Please tick one only)
□ Yes
□ No
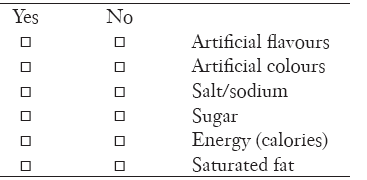
22. Are you concerned about these aspects of the food you eat? (Please tick ‘yes’ or ‘no’ for each option)
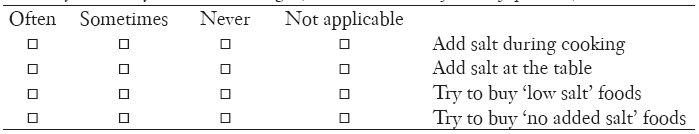
23. Do you do any of the following? (Please tick one box for every question)
24. Are you cutting down on the amount of salt you eat? (Please tick one only)
□ Yes
□ No
□ Don’t know
If yes, why are you cutting down on salt?
□ I have been told to by a doctor/other health professional
□ Another family member has been told to
□ Because it’s bad for you
□ Because I am on a diet
□ To help lower my blood pressure
□ Because I have health problems
□ To reduce my risk of a heart attack or stroke
□ I don’t like the taste of it
□ Saw an advert/article about it/something on TV
□ Trying to eat more healthily
□ Other (specify) __________
□ Don’t knowIf no, why aren’t you cutting down on salt?
□ I recently cut back and don’t need to cut back any further
□ I didn’t know I should
□ I eat a healthy diet and know I’m not eating too much salt
□ I’m not concerned by it
□ I haven’t been told to cut salt from my diet
□ No particular reason, hadn’t really thought about it
□ You need to eat salt to stay healthy
□ I don’t have too much salt in my diet
□ I don’t add salt to my food (anymore)
□ I don’t eat food high in salt
□ Other (specify) __________
□ Don’t know
25. Reducing the amount of salt you add to foods is definitely important to you. (Please tick one only)
□ Strongly disagree
□ Disagree
□ Neither agree nor disagree
□ Agree
□ Strongly agree
26. Reducing the amount of processed foods (e.g., breads, cured meats, canned foods and takeaway) you eat is definitely important to you. (Please tick one only)
□ Strongly disagree 1
□ Disagree2
□ Neither agree nor disagree3
□ Agree4
□ Strongly agree5
27. Reducing your sodium intake is definitely important to you (Please tick one only)
□ Strongly disagree 1
□ Disagree2
□ Neither agree nor disagree3
□ Agree4
□ Strongly agree5
28. What would motivate you to reduce your salt intake? (Please tick one only)
□ A dramatic change in health status 1
□ If my doctor advised it2
□ If family members or friends advised it 3
□ Other (specify): __________ 4
29. What are the barriers against decreasing your salt intake? (Please tick one only)
□ It tastes good 1
□ I am not concerned with decreasing my salt intake 2
□ I don’t know which foods to avoid 3
□ Other (specify): ___________ 4
30. What is the most frightening thing that could happen if you eat too much salt? (Please tick one only)
□ Nothing bad will happen
□ I could have a heart attack or stroke
□ My blood pressure will go up
□ Other (specify): __________
31. Where do you get your health information from? (Please tick one only)
□ My doctor
□ My family and friends
□ The internet
□ The media (specify): □ television □ radio □ newspapers □ magazines □ other: ___________
□ Other (specify): __________
32. If excess salt/sodium in the diet were known to cause a serious disease who do you think should be MOST responsible for helping you reduce the salt/sodium you eat? (Please tick one only)
□ The government (public health campaign)
□ Companies that make or sell foods with salt in them (food industry)
□ Your doctor
□ Yourself
33. Have you been previously advised by a physician, nurse or dietitian about the risks of a salt-rich diet and the need to moderate salt intake? (Please tick one only)
□ Yes
□ No
□ Cannot remember
34. Have you been approached by a dietitian during your CCU stay? (Please tick one only)
□ Yes
□ No
Supplementary 2
The ANN model obtained based on bootstrap analysis with 200 iterations
To predict the behavioral class using ANN, the following procedure must be followed.
First you form the vector P by the following components:
P= (q9, q10b, q10c, q10d, q11, q13, q14a, q14n, sbpn, dbpn, pulsen, smk, htn)
Where q9, q10b, q10c, q10d, q11, q13, q14a, q14n are equal to 1 if the patient answers the corresponding question correctly and −1 otherwise.
Smk is 1 if the patient is smoker and −1 otherwise.
Htn is 1 is the patient has a history in hypertension and −1 otherwise.
Sbpn is the normalized systolic blood pressure given by: sbpn=0.0123.sbp−1.1595
dbpn is the normalized diastolic blood pressure given by: dbpn=0.0263.dbp−1.7895
pulsen is the normalized pulse rate given by: pulsen=0.0125.pulse−1.2727.
Where sbp, dbp and pulse are the corresponding non normalized values.
The output n1 of the first layer is given by:
N1=p.A1+b1.
Where A1 is shown in Figure S2.

And b1 is the following vector:
B1= (1.6118, −1.5348, −0.895, −0.85492, 0.29956, −0.27295, 0.43393, 0.92673, −1.2202, −1.6814)
The output N1 is then sent to the tansig activation function which is described earlier to get the final output A1 of layer1 as:
A1=tansig(N1)
The next step is to send A1 into the last layer of the network. The output of the second layer is calculated as follows:
N2= A1.B +0.489
Where B is following column vector:
B = (−0.898, 0.090858, −0.0062721, 0.076167, −0.3859, −1.3466, 0.4678, 0.56129, 0.35015, 0.39472)T
Then the final output A2 is obtained by:
A2= tansig (N2)+2
If A2<1.5 then the patient is classified as unfavorable.
If 1.5<A2<2.5 then the patient is classified as less favorable
If A2>2.5 then the patient is classified as favorable.
References
- Friedlander Y, Siscovick DS, Weinmann S, et al. Family history as a risk factor for primary cardiac arrest. Circulation 1998;97:155-60. [PubMed]
- Joffres MR, Campbell NR, Manns B, et al. Estimate of the benefits of a population-based reduction in dietary sodium additives on hypertension and its related health care costs in Canada. Can J Cardiol 2007;23:437-43. [PubMed]
- Fabrigar LR, Petty RE, Smith SM, et al. Understanding knowledge effects on attitude-behavior consistency: the role of relevance, complexity, and amount of knowledge. J Pers Soc Psychol 2006;90:556-77. [PubMed]
- Sharma SV, Gernand AD, Day RS. Nutrition knowledge predicts eating behavior of all food groups except fruits and vegetables among adults in the Paso del Norte region: Qué Sabrosa Vida. J Nutr Educ Behav 2008;40:361-8. [PubMed]
- Harnack L, Block G, Subar A, et al. Association of cancer prevention-related nutrition knowledge, beliefs, and attitudes to cancer prevention dietary behavior. J Am Diet Assoc 1997;97:957-65. [PubMed]
- Claro RM, Linders H, Ricardo CZ, et al. Consumer attitudes, knowledge, and behavior related to salt consumption in sentinel countries of the Americas. Rev Panam Salud Publica 2012;32:265-73. [PubMed]
- Arcand J, Mendoza J, Qi Y, et al. Results of a national survey examining Canadians' concern, actions, barriers, and support for dietary sodium reduction interventions. Can J Cardiol 2013;29:628-31. [PubMed]
- Morton JF, Guthrie JF. Diet-related knowledge, attitudes, and practices of low-income individuals with children in the household. Family Economics and Nutrition Review 1997;10:2.
- Ugrinowitsch C, Fellingham GW, Ricard MD. Limitations of ordinary least squares models in analyzing repeated measures data. Med Sci Sports Exerc 2004;36:2144-8. [PubMed]
- Zou J, Han Y, So SS. Overview of artificial neural networks. Methods Mol Biol 2008;458:15-23. [PubMed]
- Reingold E. Artificial Neural Networks. In: Artificial Intelligence Tutorial Reviewed. University of Toronto Mississauga, 1999. Available online: http://psych.utoronto.ca/users/reingold/courses/ai/
- Zheng B, Thompson K, Lam SS, et al. eds. Customers' Behavior Prediction Using Artificial Neural Network. Industrial and Systems Engineering Research Conference; 2013; Puerto Rico: Xerox Innovation Group. Available online: http://www.iienet2.org/uploadedFiles/IIE/Community/Technical_Societies_and_Divisions/SEMS/Abstract_909.pdf
- Tusche A, Bode S, Haynes JD. Neural responses to unattended products predict later consumer choices. J Neurosci 2010;30:8024-31. [PubMed]
- Zhang Z, Vanderhaegen F, Millot P. Prediction of Human Behaviour Using Artificial Neural Networks. Lecture Notes in Computer Science 2006;3930:770-9.
- Trost SG, Wong WK, Pfeiffer KA, et al. Artificial neural networks to predict activity type and energy expenditure in youth. Med Sci Sports Exerc 2012;44:1801-9. [PubMed]
- Borowiec A, Fronczyk K, Macukow B, et al. Can Neural Networks Be Used to Define the Rules of Cardiovascular Disease Prevention in the Nutrition Domain? Advances in Soft Computing 2003;19:450-5.
- Nasreddine L, Akl C, Al-Shaar L, et al. Consumer knowledge, attitudes and salt-related behavior in the Middle-East: the case of Lebanon. Nutrients 2014;6:5079-102. [PubMed]
- 2007 survey of Australian consumer awareness and practices relating to salt. ustralia: The George Institute for International Health 2007. Available online: http://www.awash.org.au/wp-content/uploads/2012/10/AWASH_ConsumerSurveyReport_2007_05_15.pdf
- Wyllie A, Moore R, Brown R. Salt Consumer Survey. MAF Technical Paper No: 2011/9, Prepared for NZFSA by Phoenix Research. ISBN 978-0-478-37559-6 (online), ISSN 2230-2794 (online), March 2011, Ministry of Agriculture and Forestry. Available online: http://www.foodsafety.govt.nz/elibrary/industry/salt-survey.pdf
- Papadakis S, Pipe AL, Moroz IA, et al. Knowledge, attitudes and behaviours related to dietary sodium among 35- to 50-year-old Ontario residents. Can J Cardiol 2010;26:e164-9. [PubMed]
- Hagan M, Demuth H, Beale M. eds. Neural network design, 1st ed. Boston, MA: PWS Publishing Company, 1996.
- Scales LE. eds. Introduction to Non-Linear Optimization. Ann Arbor: Springer Verlag Gmbh, 1985.
- Jolliffe IT. eds. Principal Component Analysis. New York: Springer Science & Business Media, 2013.
- Central Administration and Statistics Population Statistics, 2009. Available online: http://www.cas.gov.lb/index.php/demographic-and-social-en/population-en. (Accessed on 28th May, 2014).
- Economic and Social Commission for Western Asia. The Demographic Profile of Lebanon. Available online: http://www.escwa.un.org/popin/members/lebanon.pdf. (Accessed on 13th June, 2014).
- Naja F, Nasreddine L, Itani L, et al. Dietary patterns and their association with obesity and sociodemographic factors in a national sample of Lebanese adults. Public Health Nutr 2011;14:1570-8. [PubMed]
- Demographic, socioeconomic, dietary and physical activity determinants of obesity in a large nationally representative sample of the Lebanese adult population. Available online: http://etheses.dur.ac.uk/7321/
- Diederichsen AC, Mahabadi AA, Gerke O, et al. Increased discordance between HeartScore and coronary artery calcification score after introduction of the new ESC prevention guidelines. Atherosclerosis 2015;239:143-9. [PubMed]
- D'Ascenzo F, Biondi-Zoccai G, Moretti C, et al. TIMI, GRACE and alternative risk scores in Acute Coronary Syndromes: a meta-analysis of 40 derivation studies on 216,552 patients and of 42 validation studies on 31,625 patients. Contemp Clin Trials 2012;33:507-14. [PubMed]
- Spronk I, Kullen C, Burdon C, et al. Relationship between nutrition knowledge and dietary intake. Br J Nutr 2014;111:1713-26. [PubMed]

